Find Your Graph Zen
Create stunning charts and visualizations in minutes, not hours. Import from CSV, Excel, or paste data directly. Professional results, complete privacy, zero complexity.
Everything You Need in One Place
A powerful yet simple interface designed for speed and clarity. Create professional charts without the complexity.
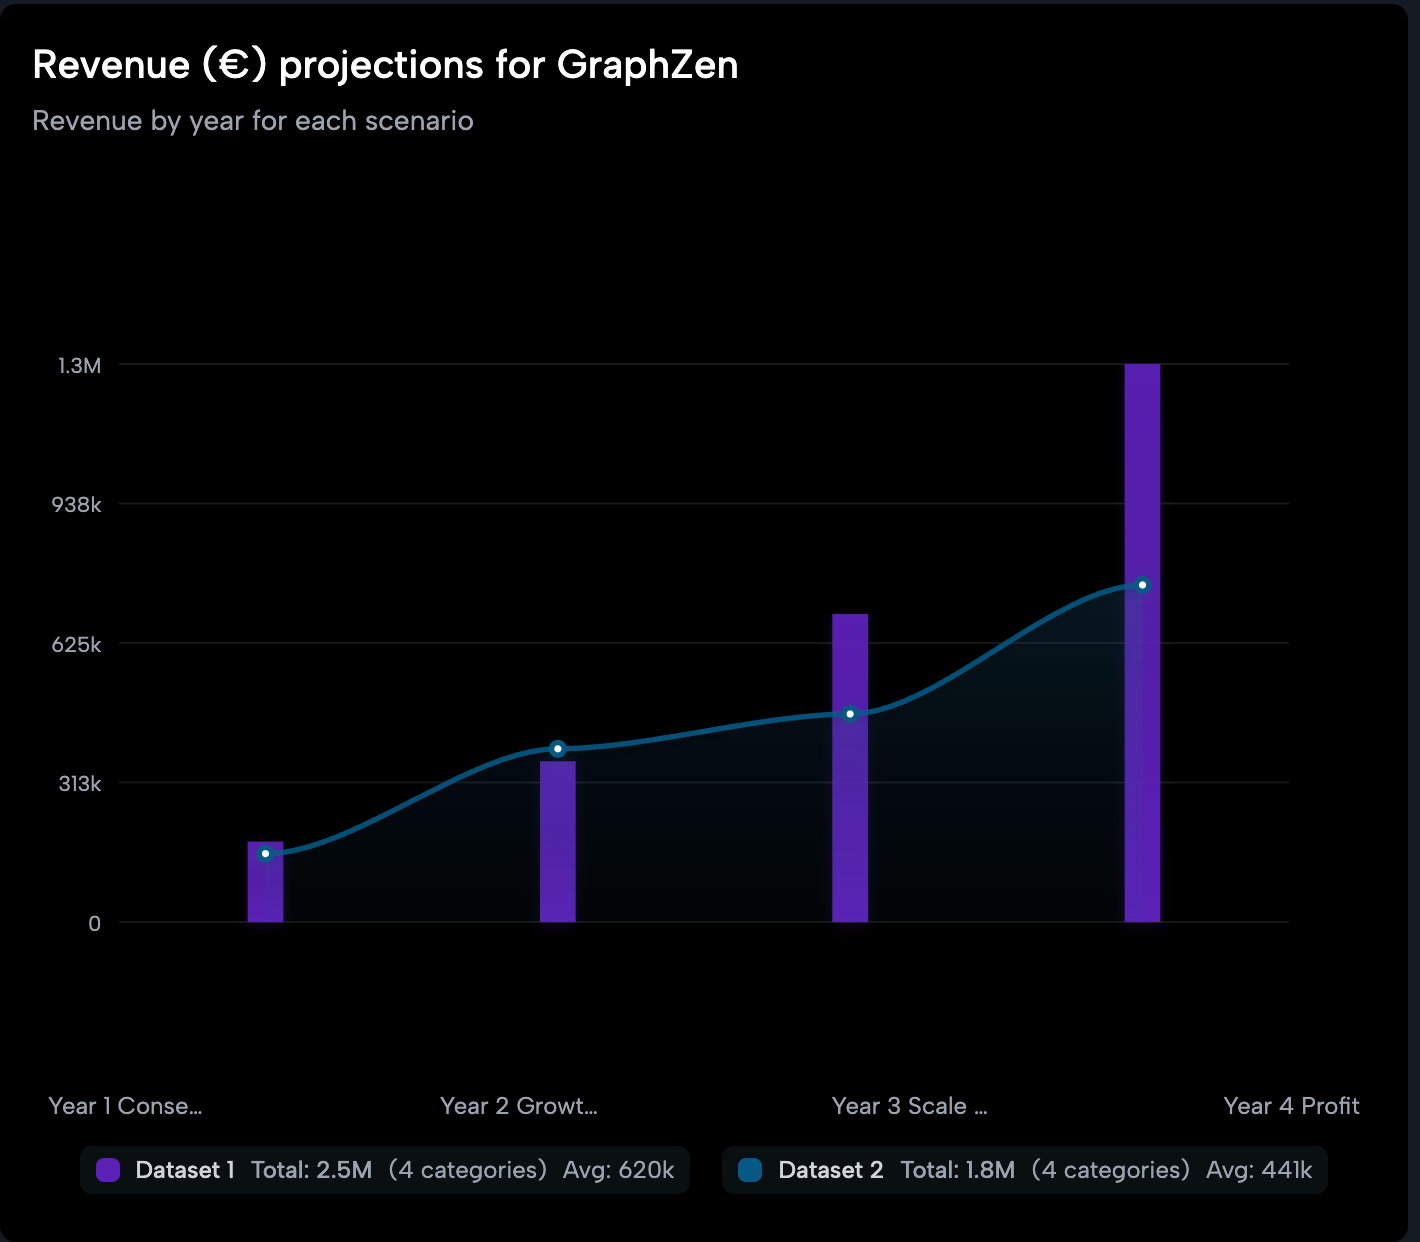
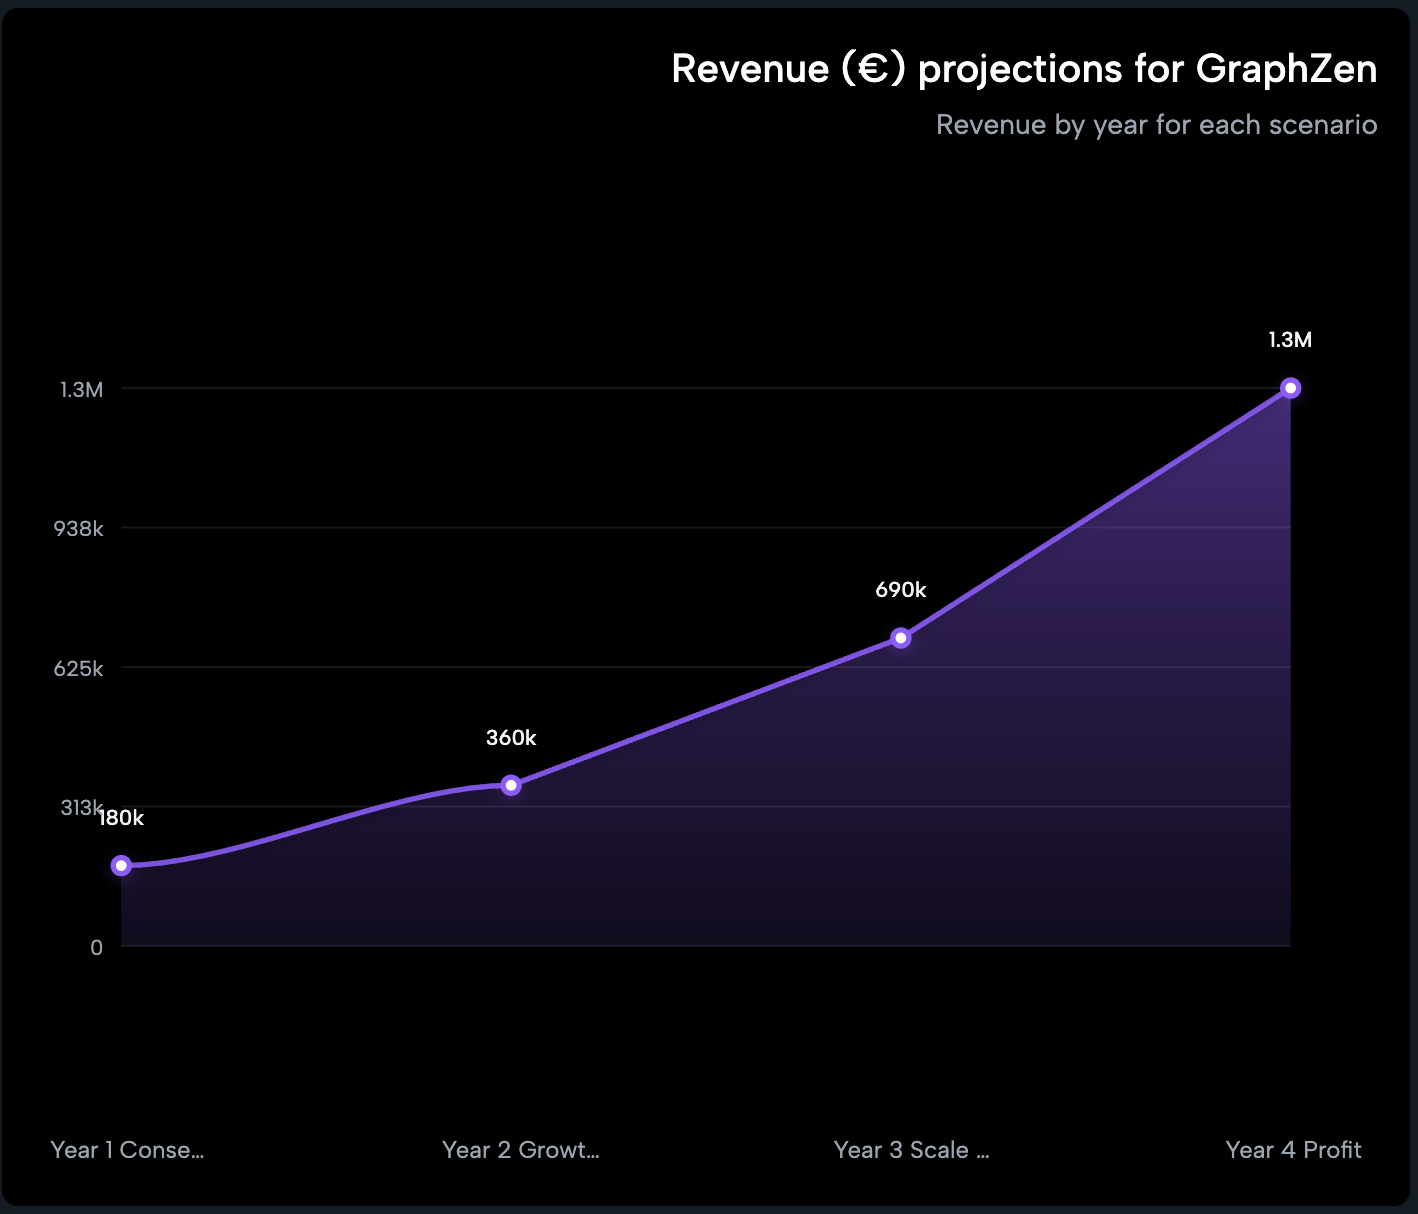
Every Chart Type You Need
From simple bar charts to complex multi-series visualizations, create professional charts that tell your data's story.
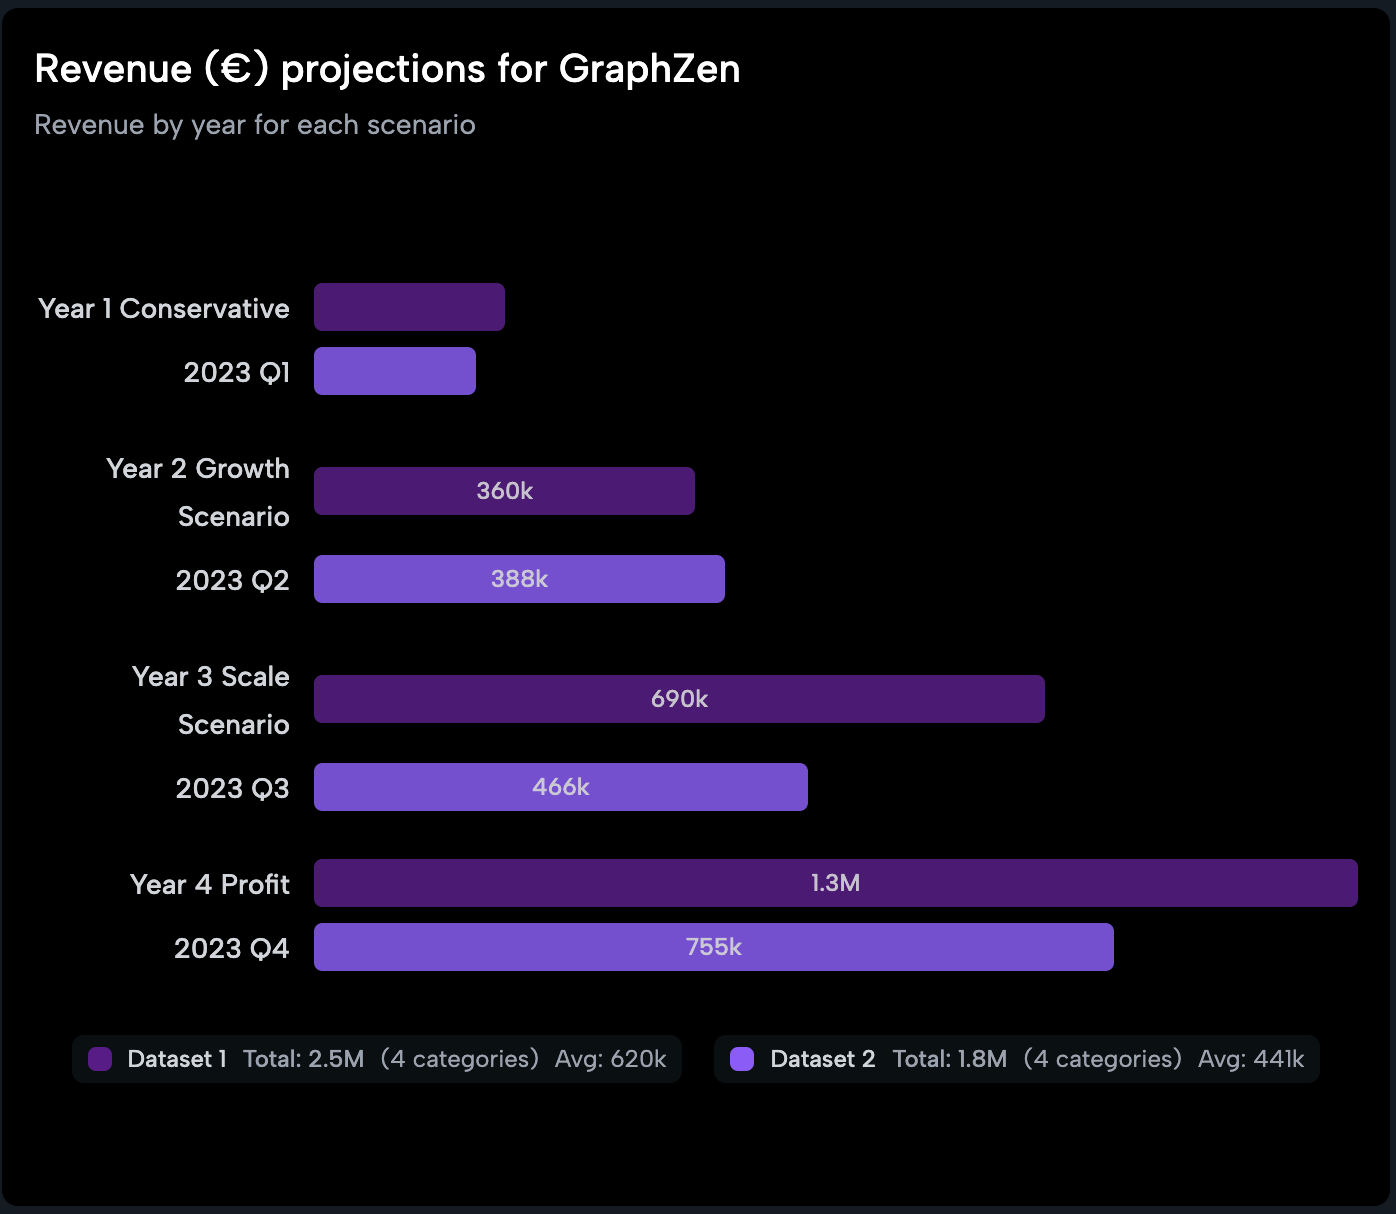
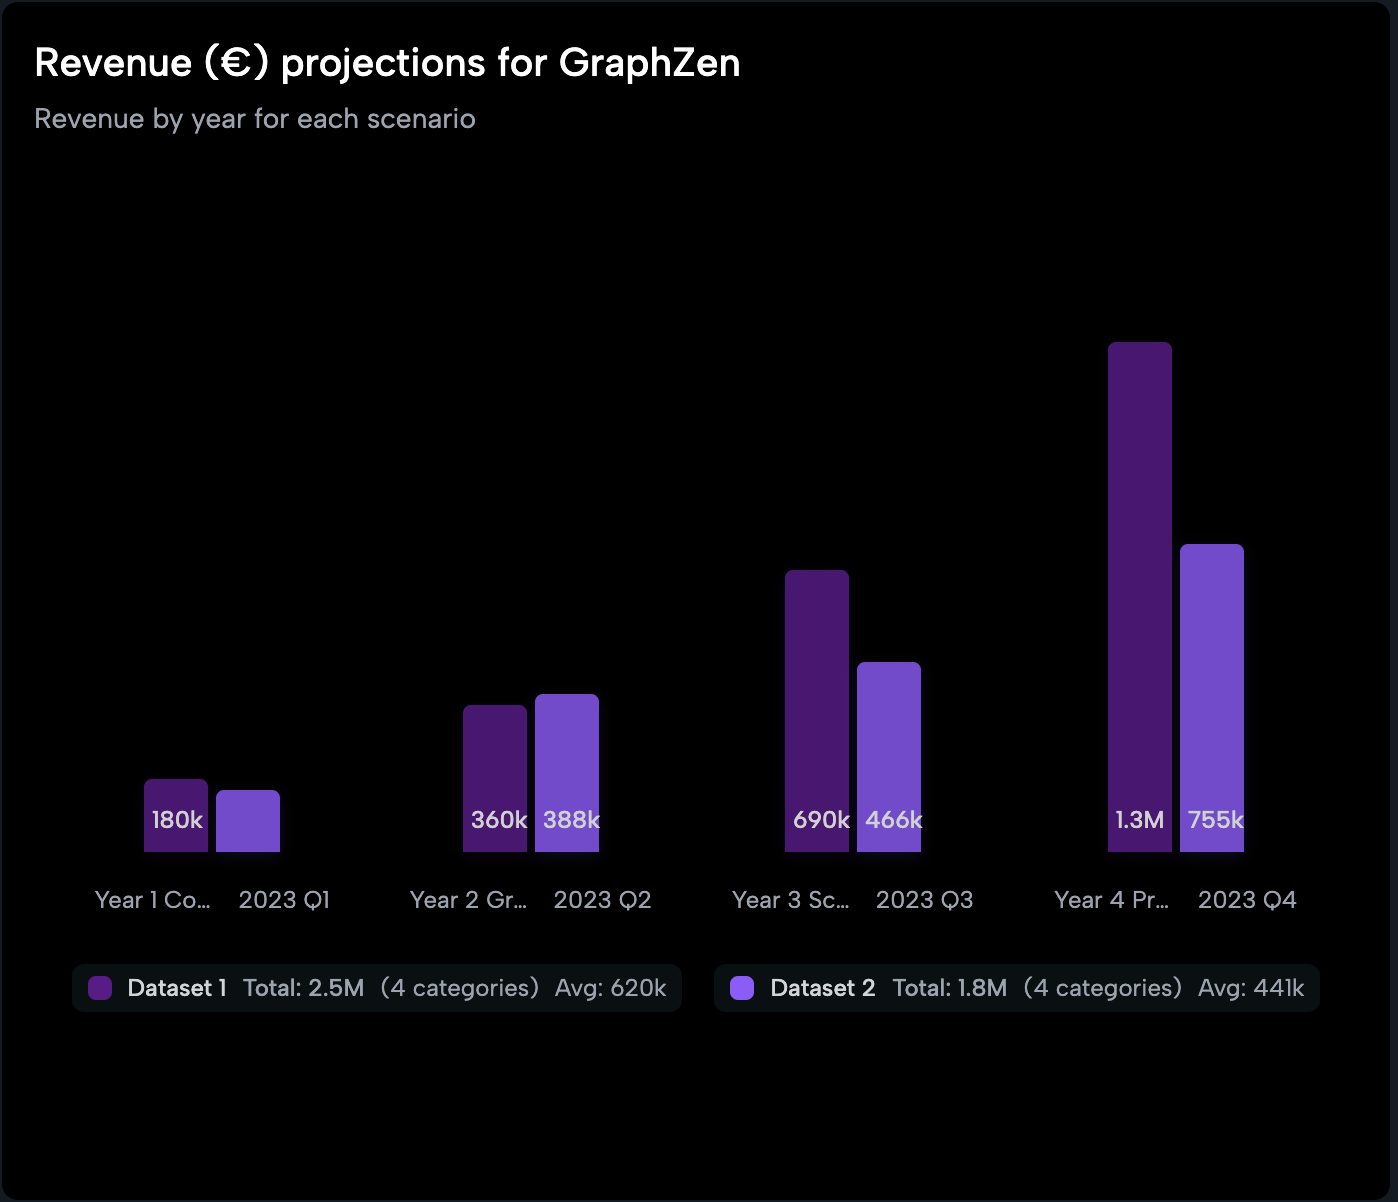
Bar Charts
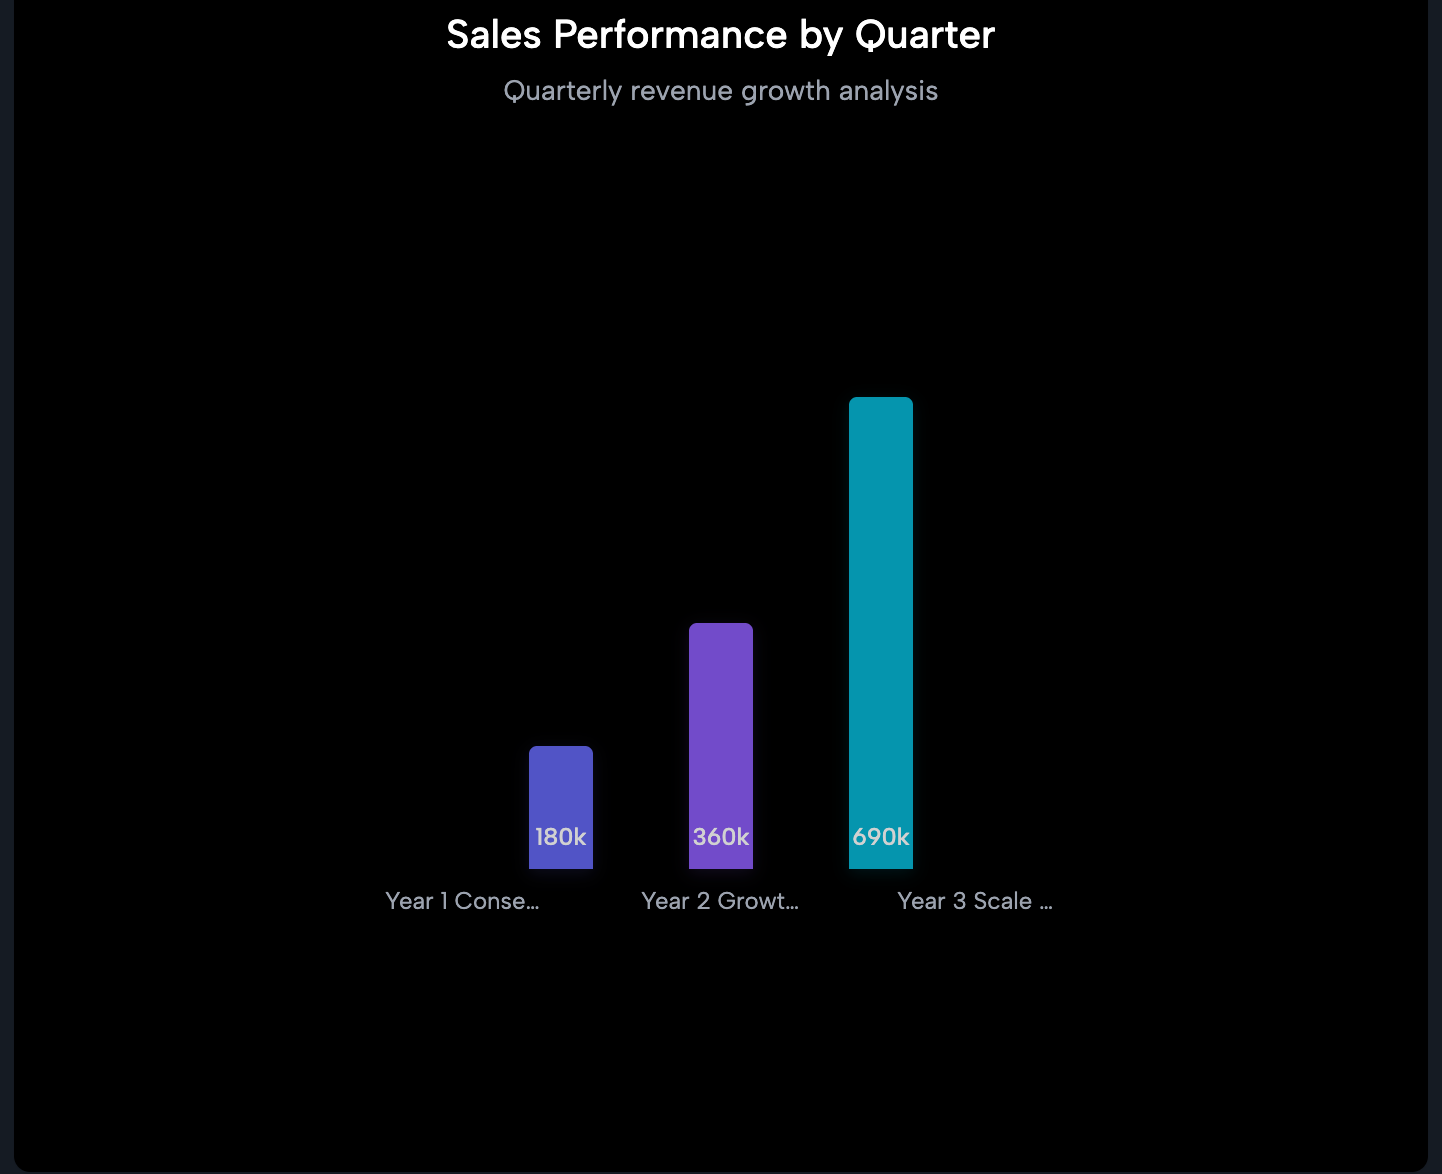
Perfect for comparing categories and showing data relationships clearly.
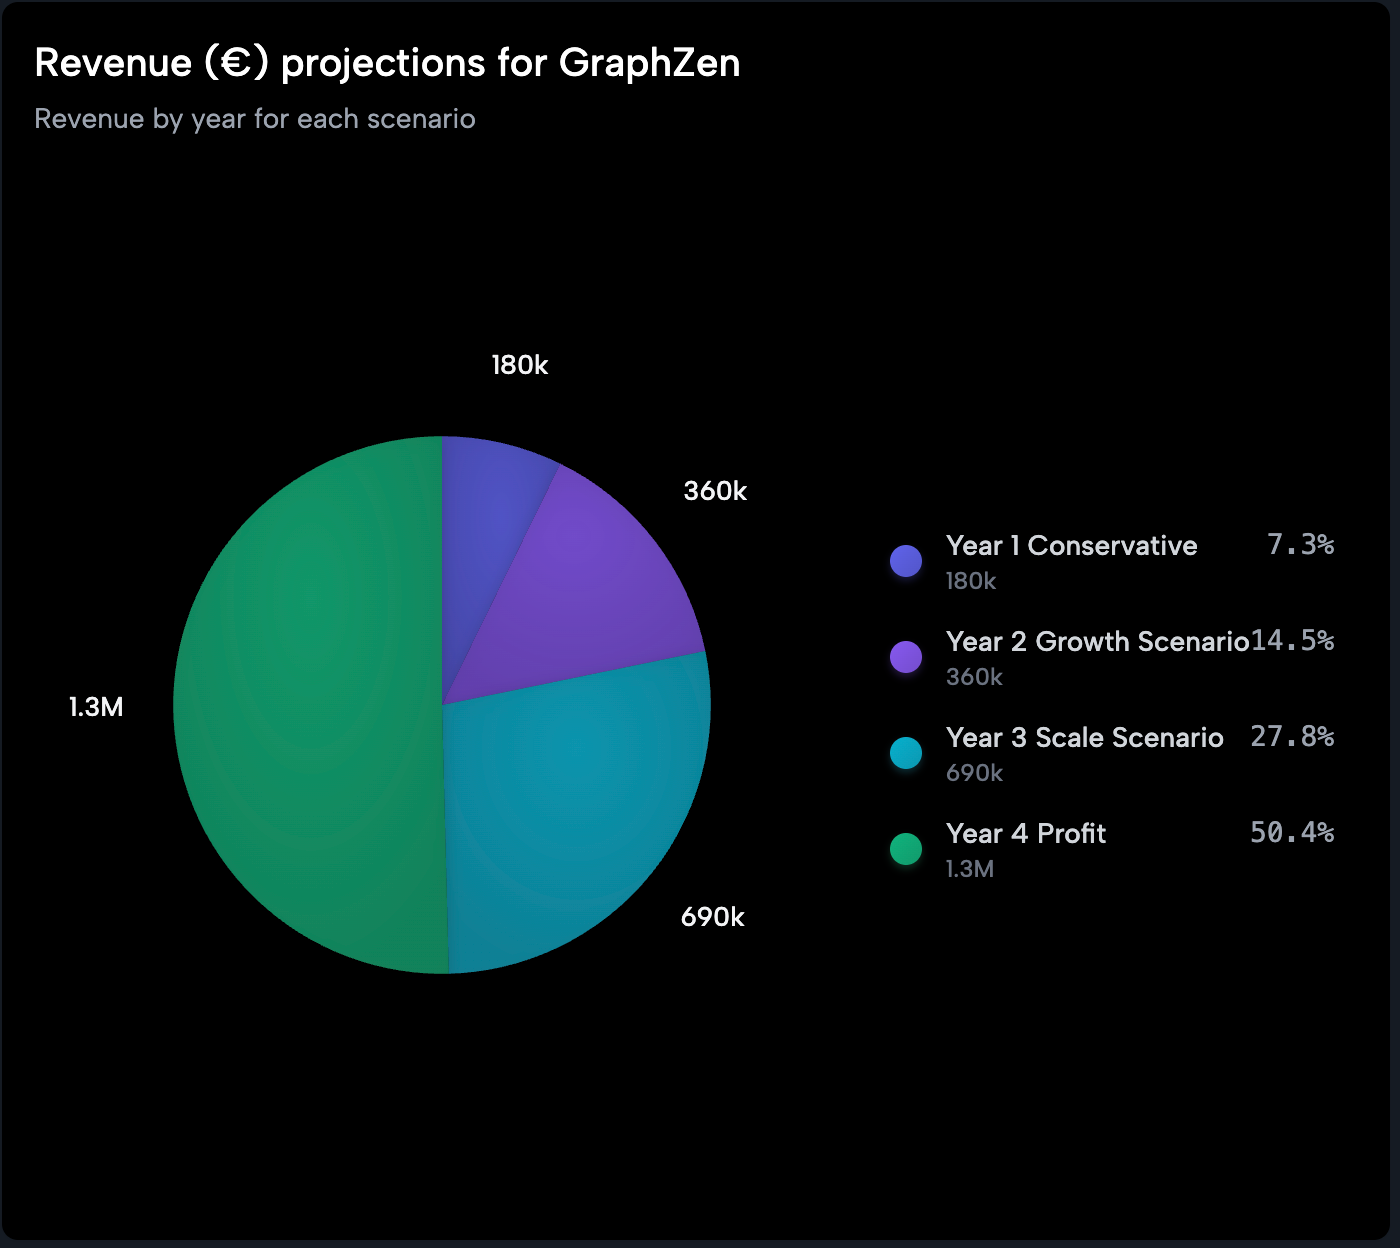
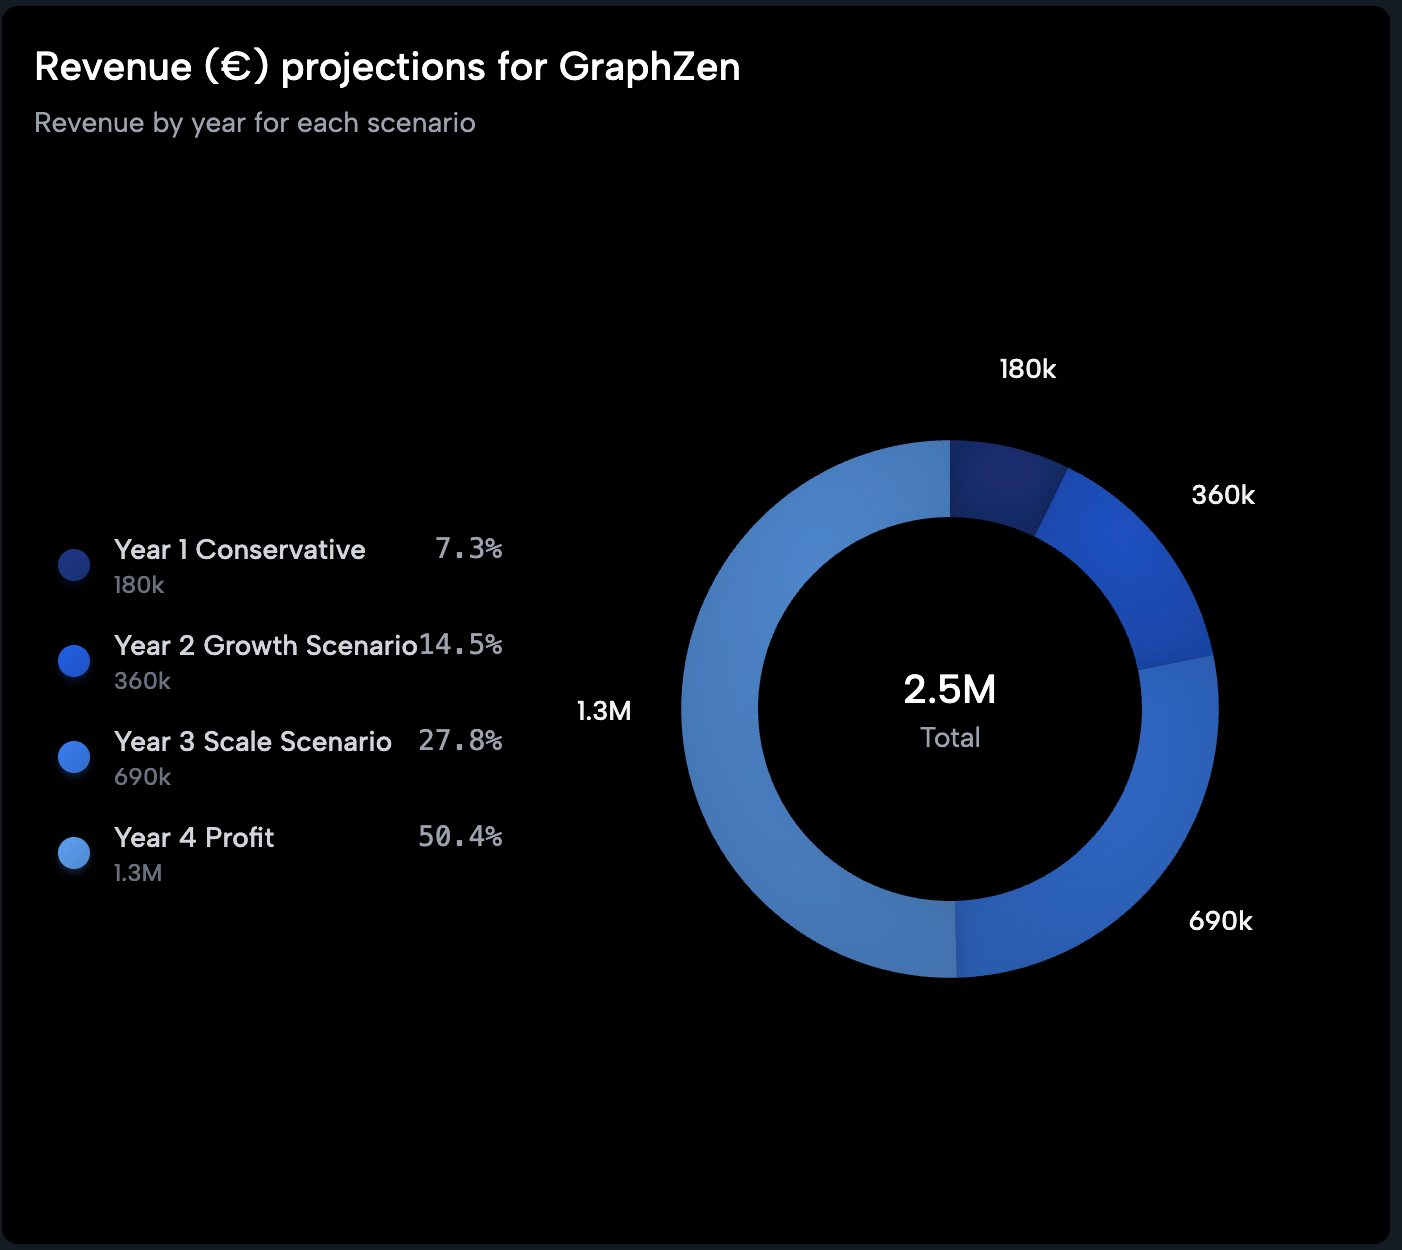
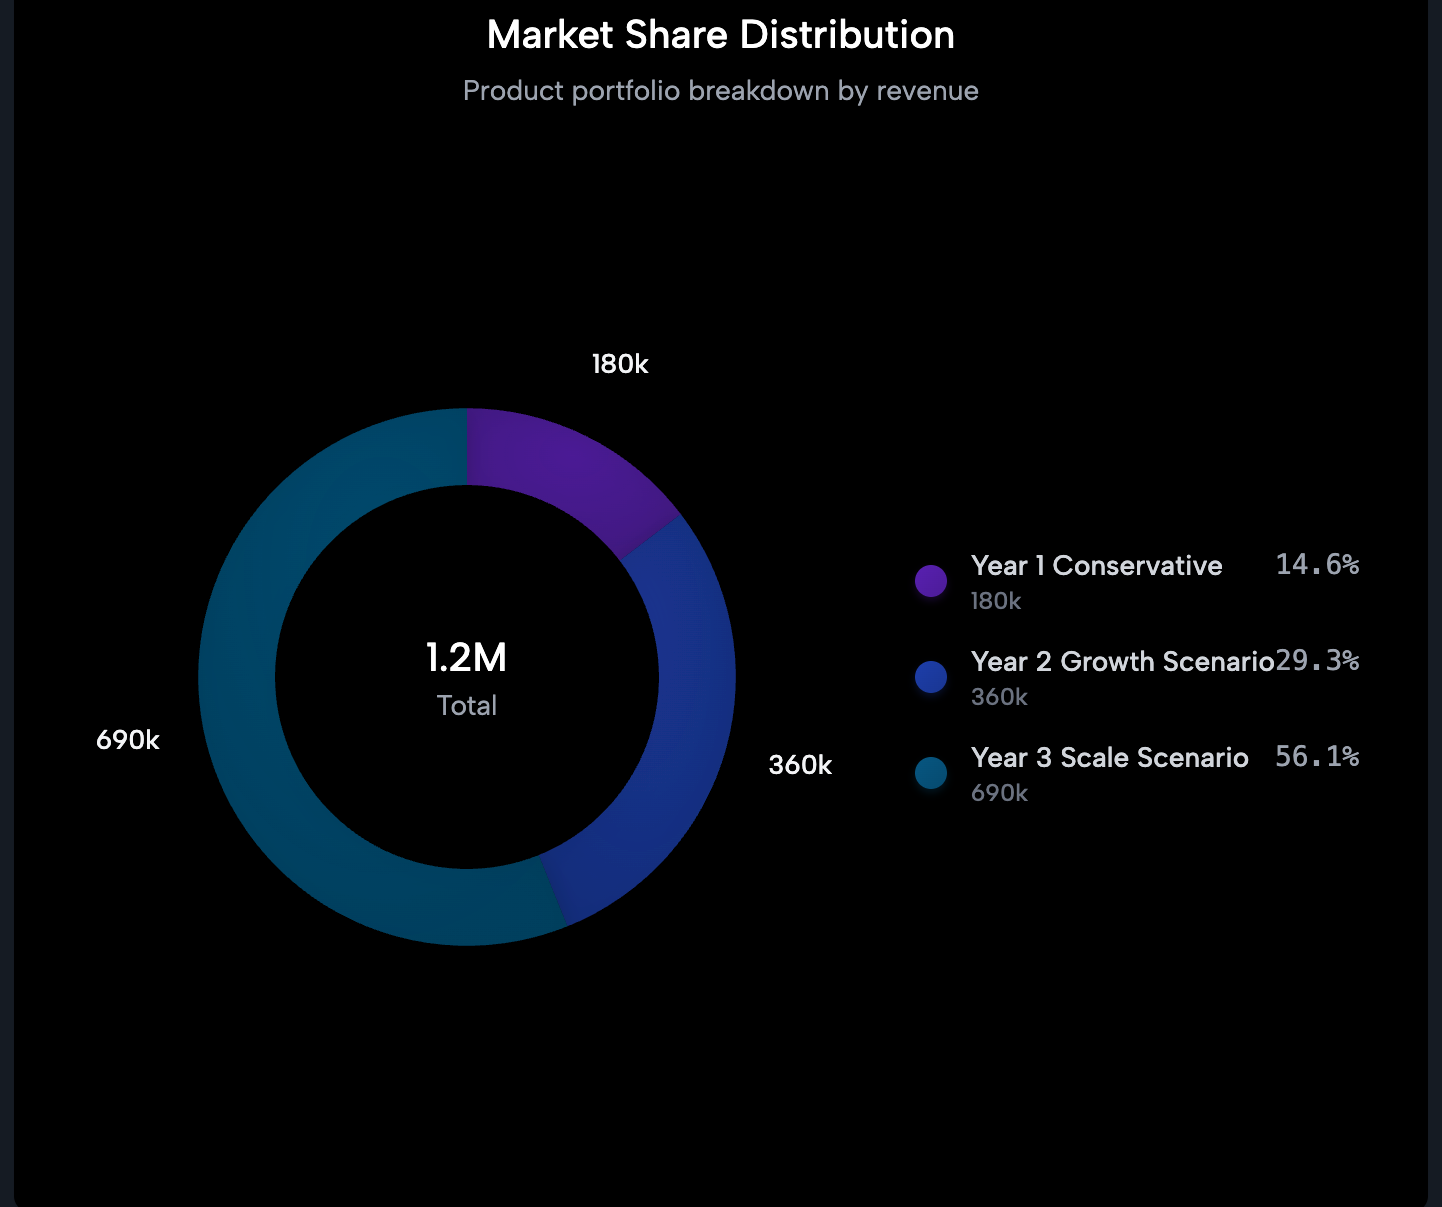
Pie & Donut Charts
Visualize proportions and percentages with elegant circular charts.
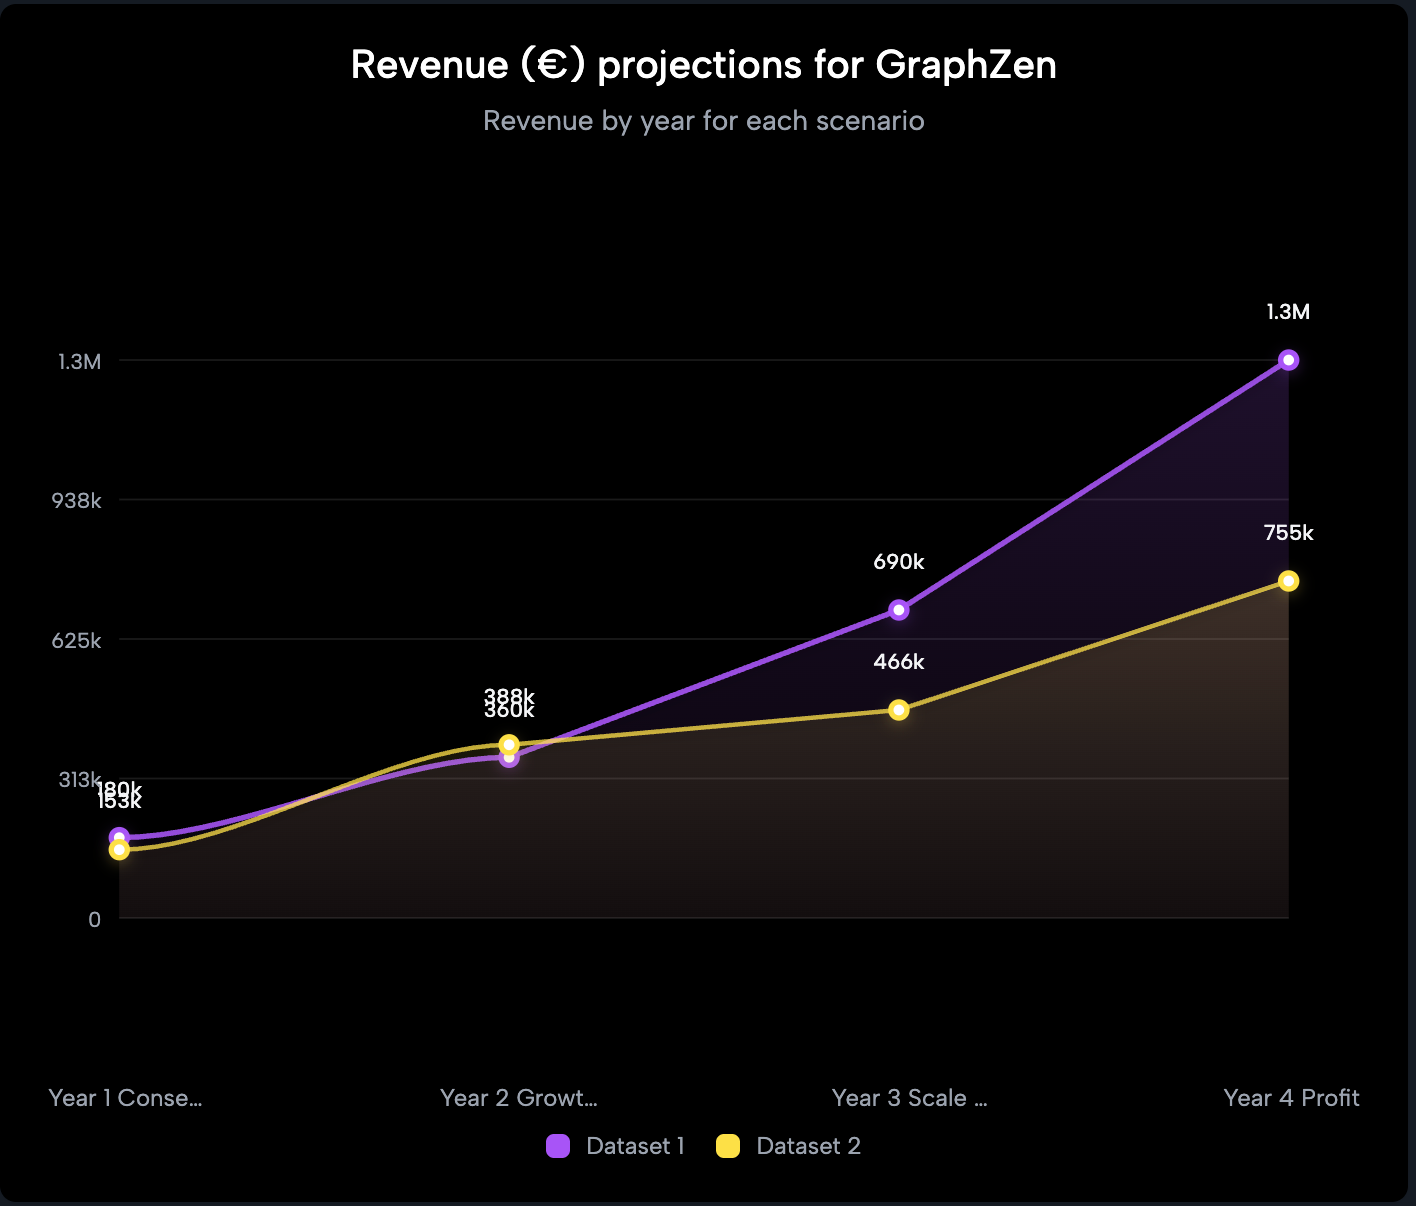
Line Charts
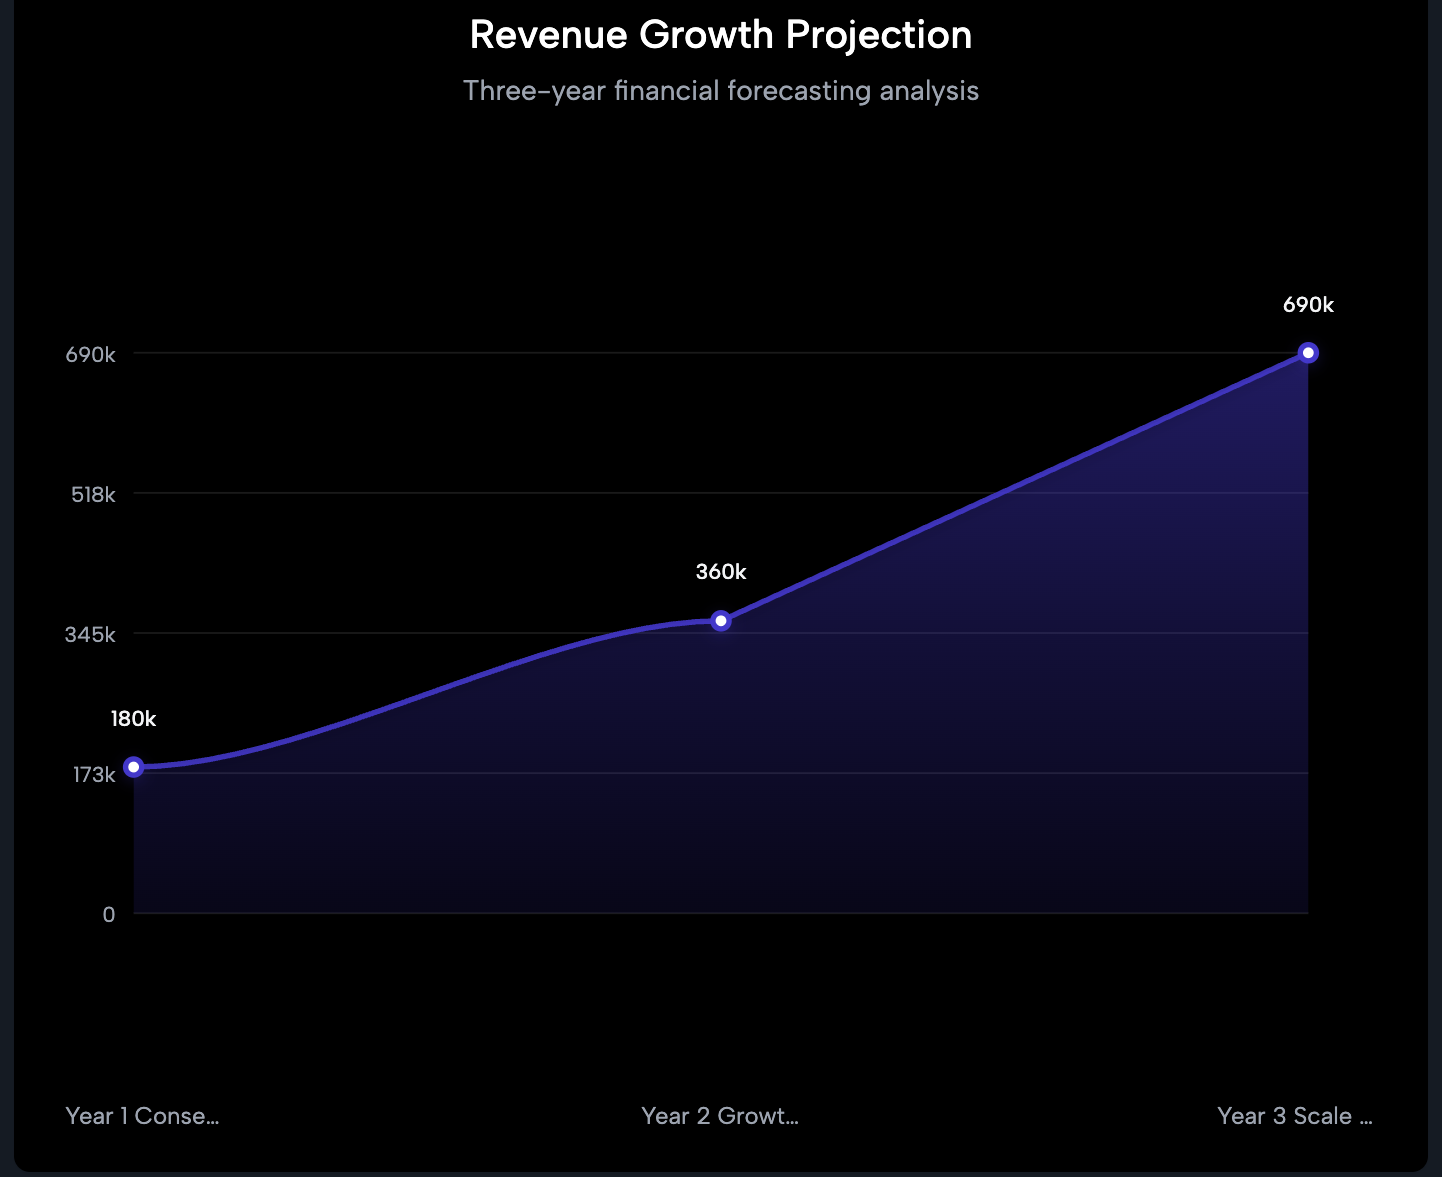
Track trends and changes over time with smooth, professional lines.
Combo Charts
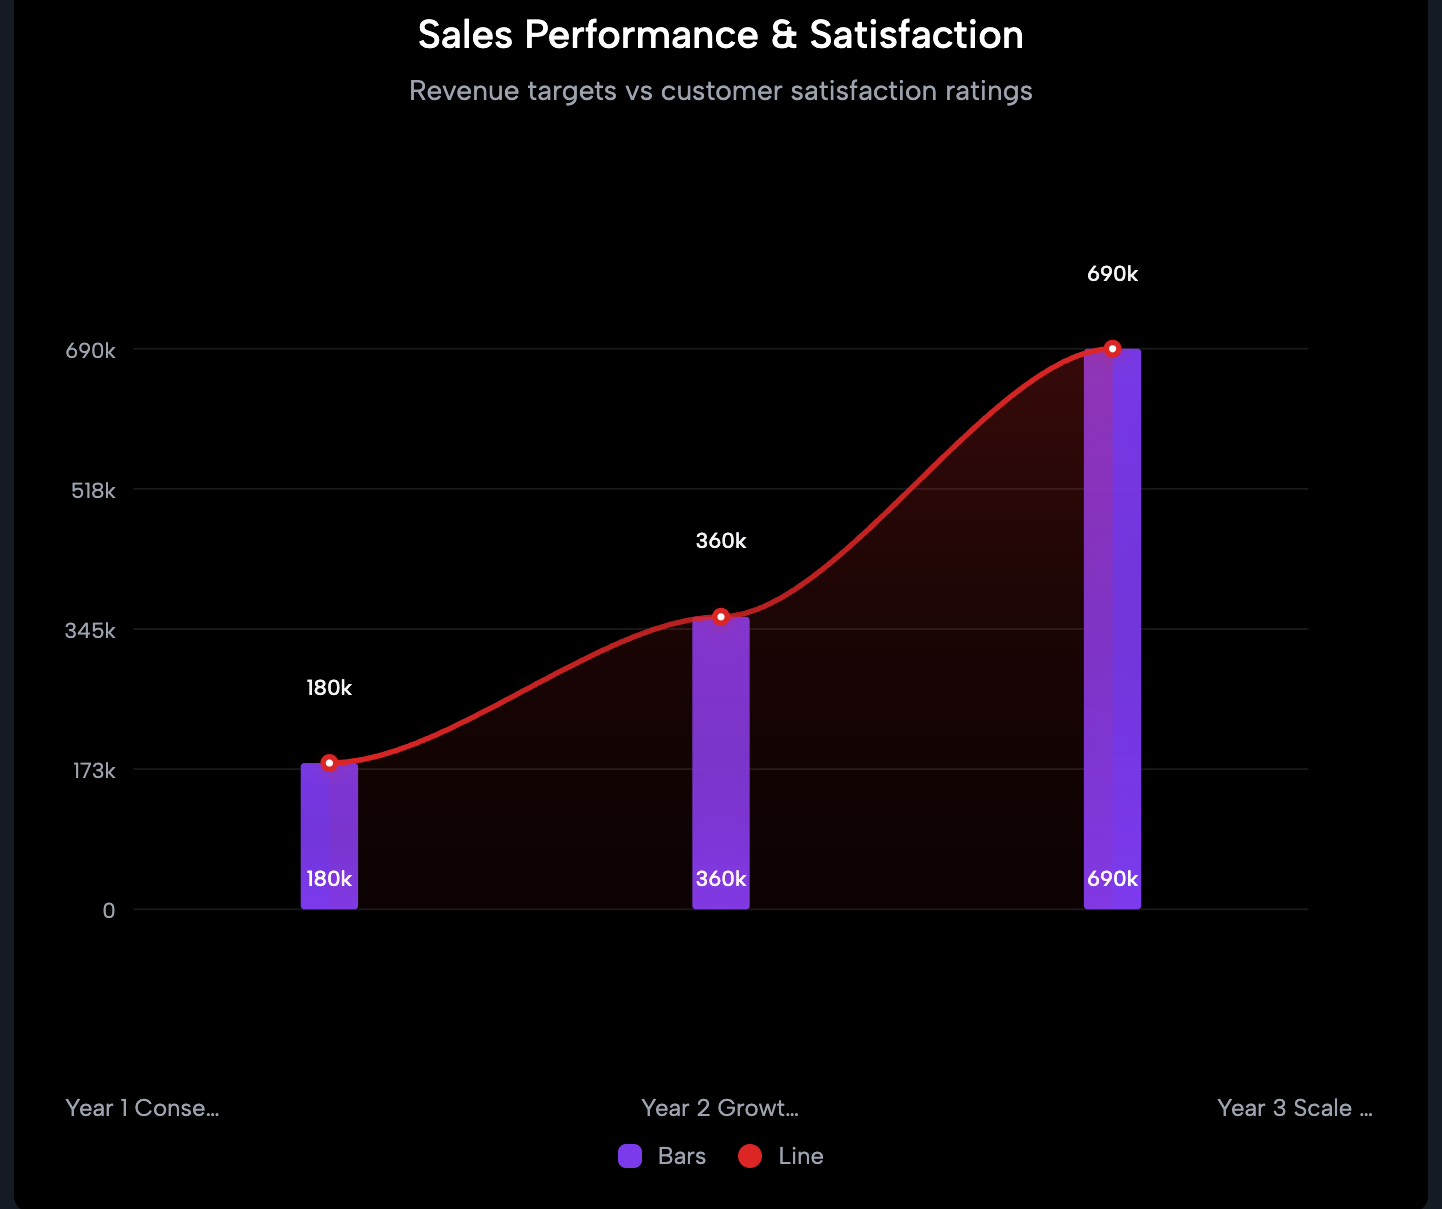
Combine multiple chart types for comprehensive data storytelling.
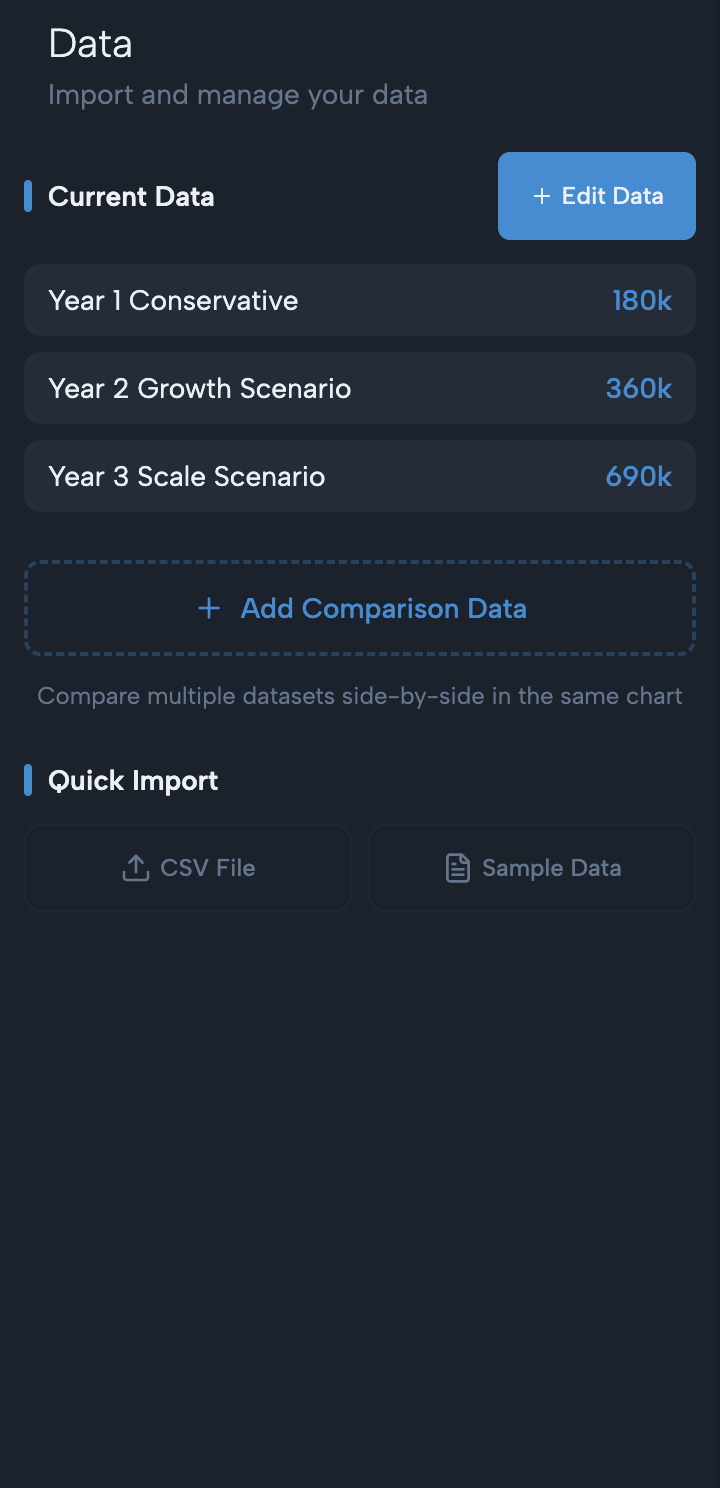
Multiple Data Sources
Import from CSV, Excel, or paste data directly. No complex setup required.
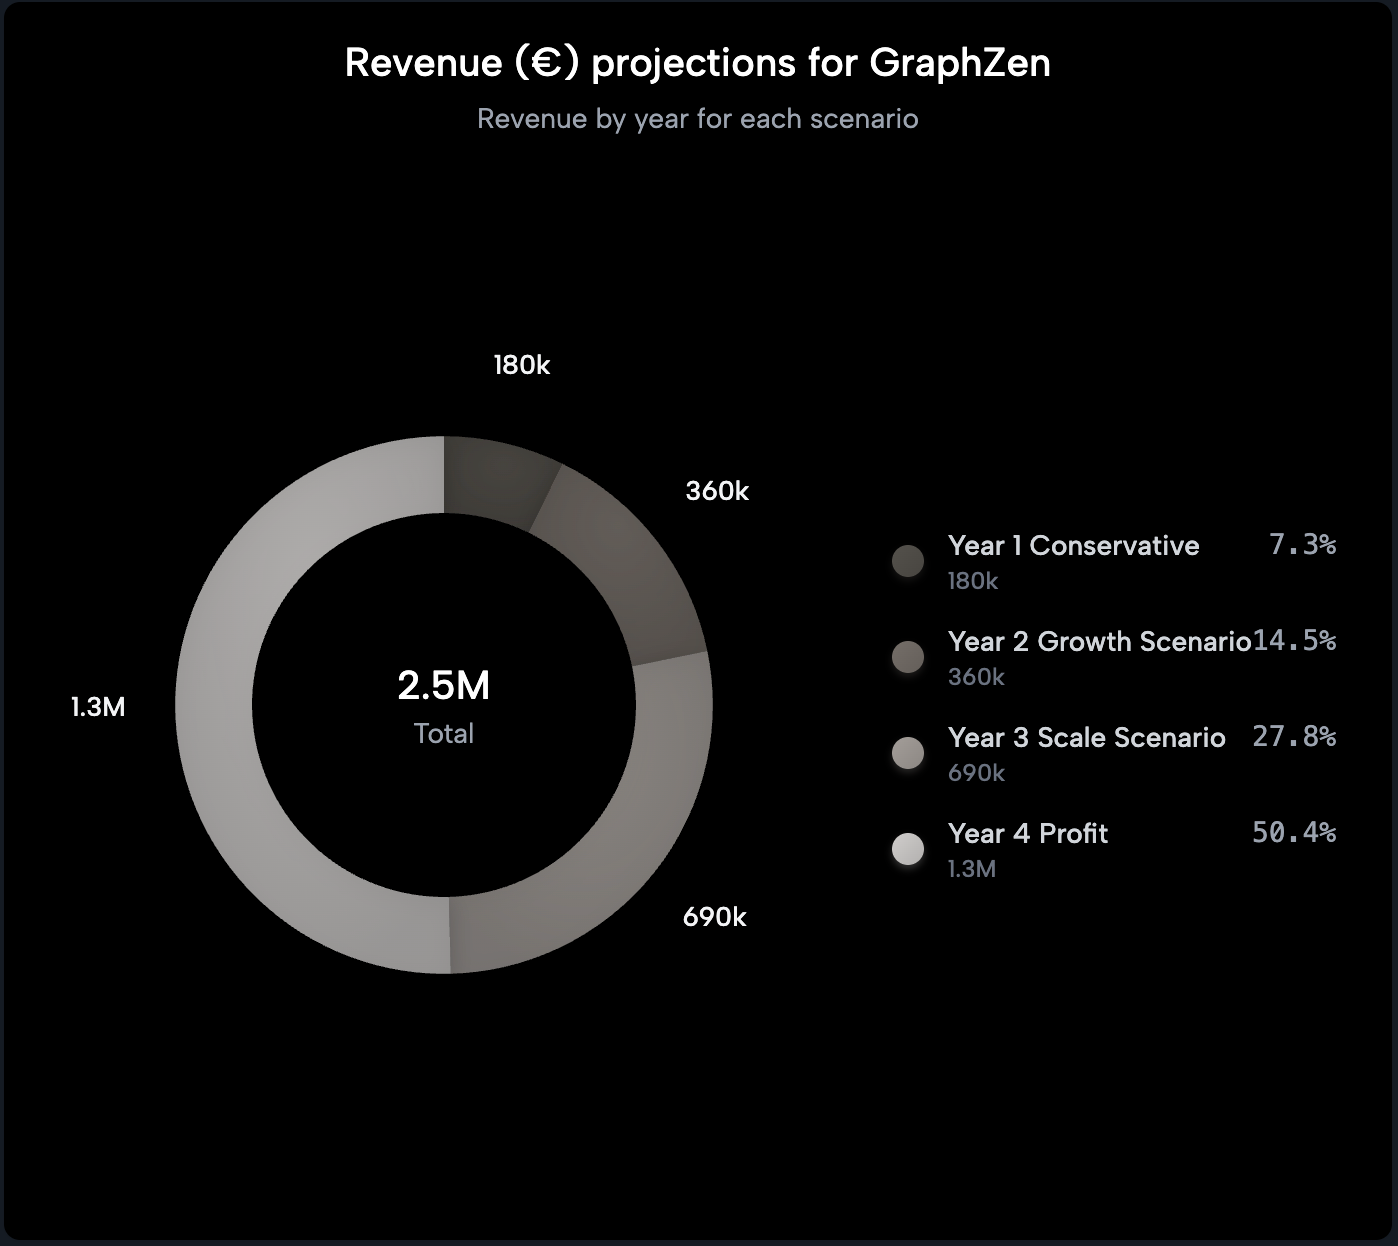
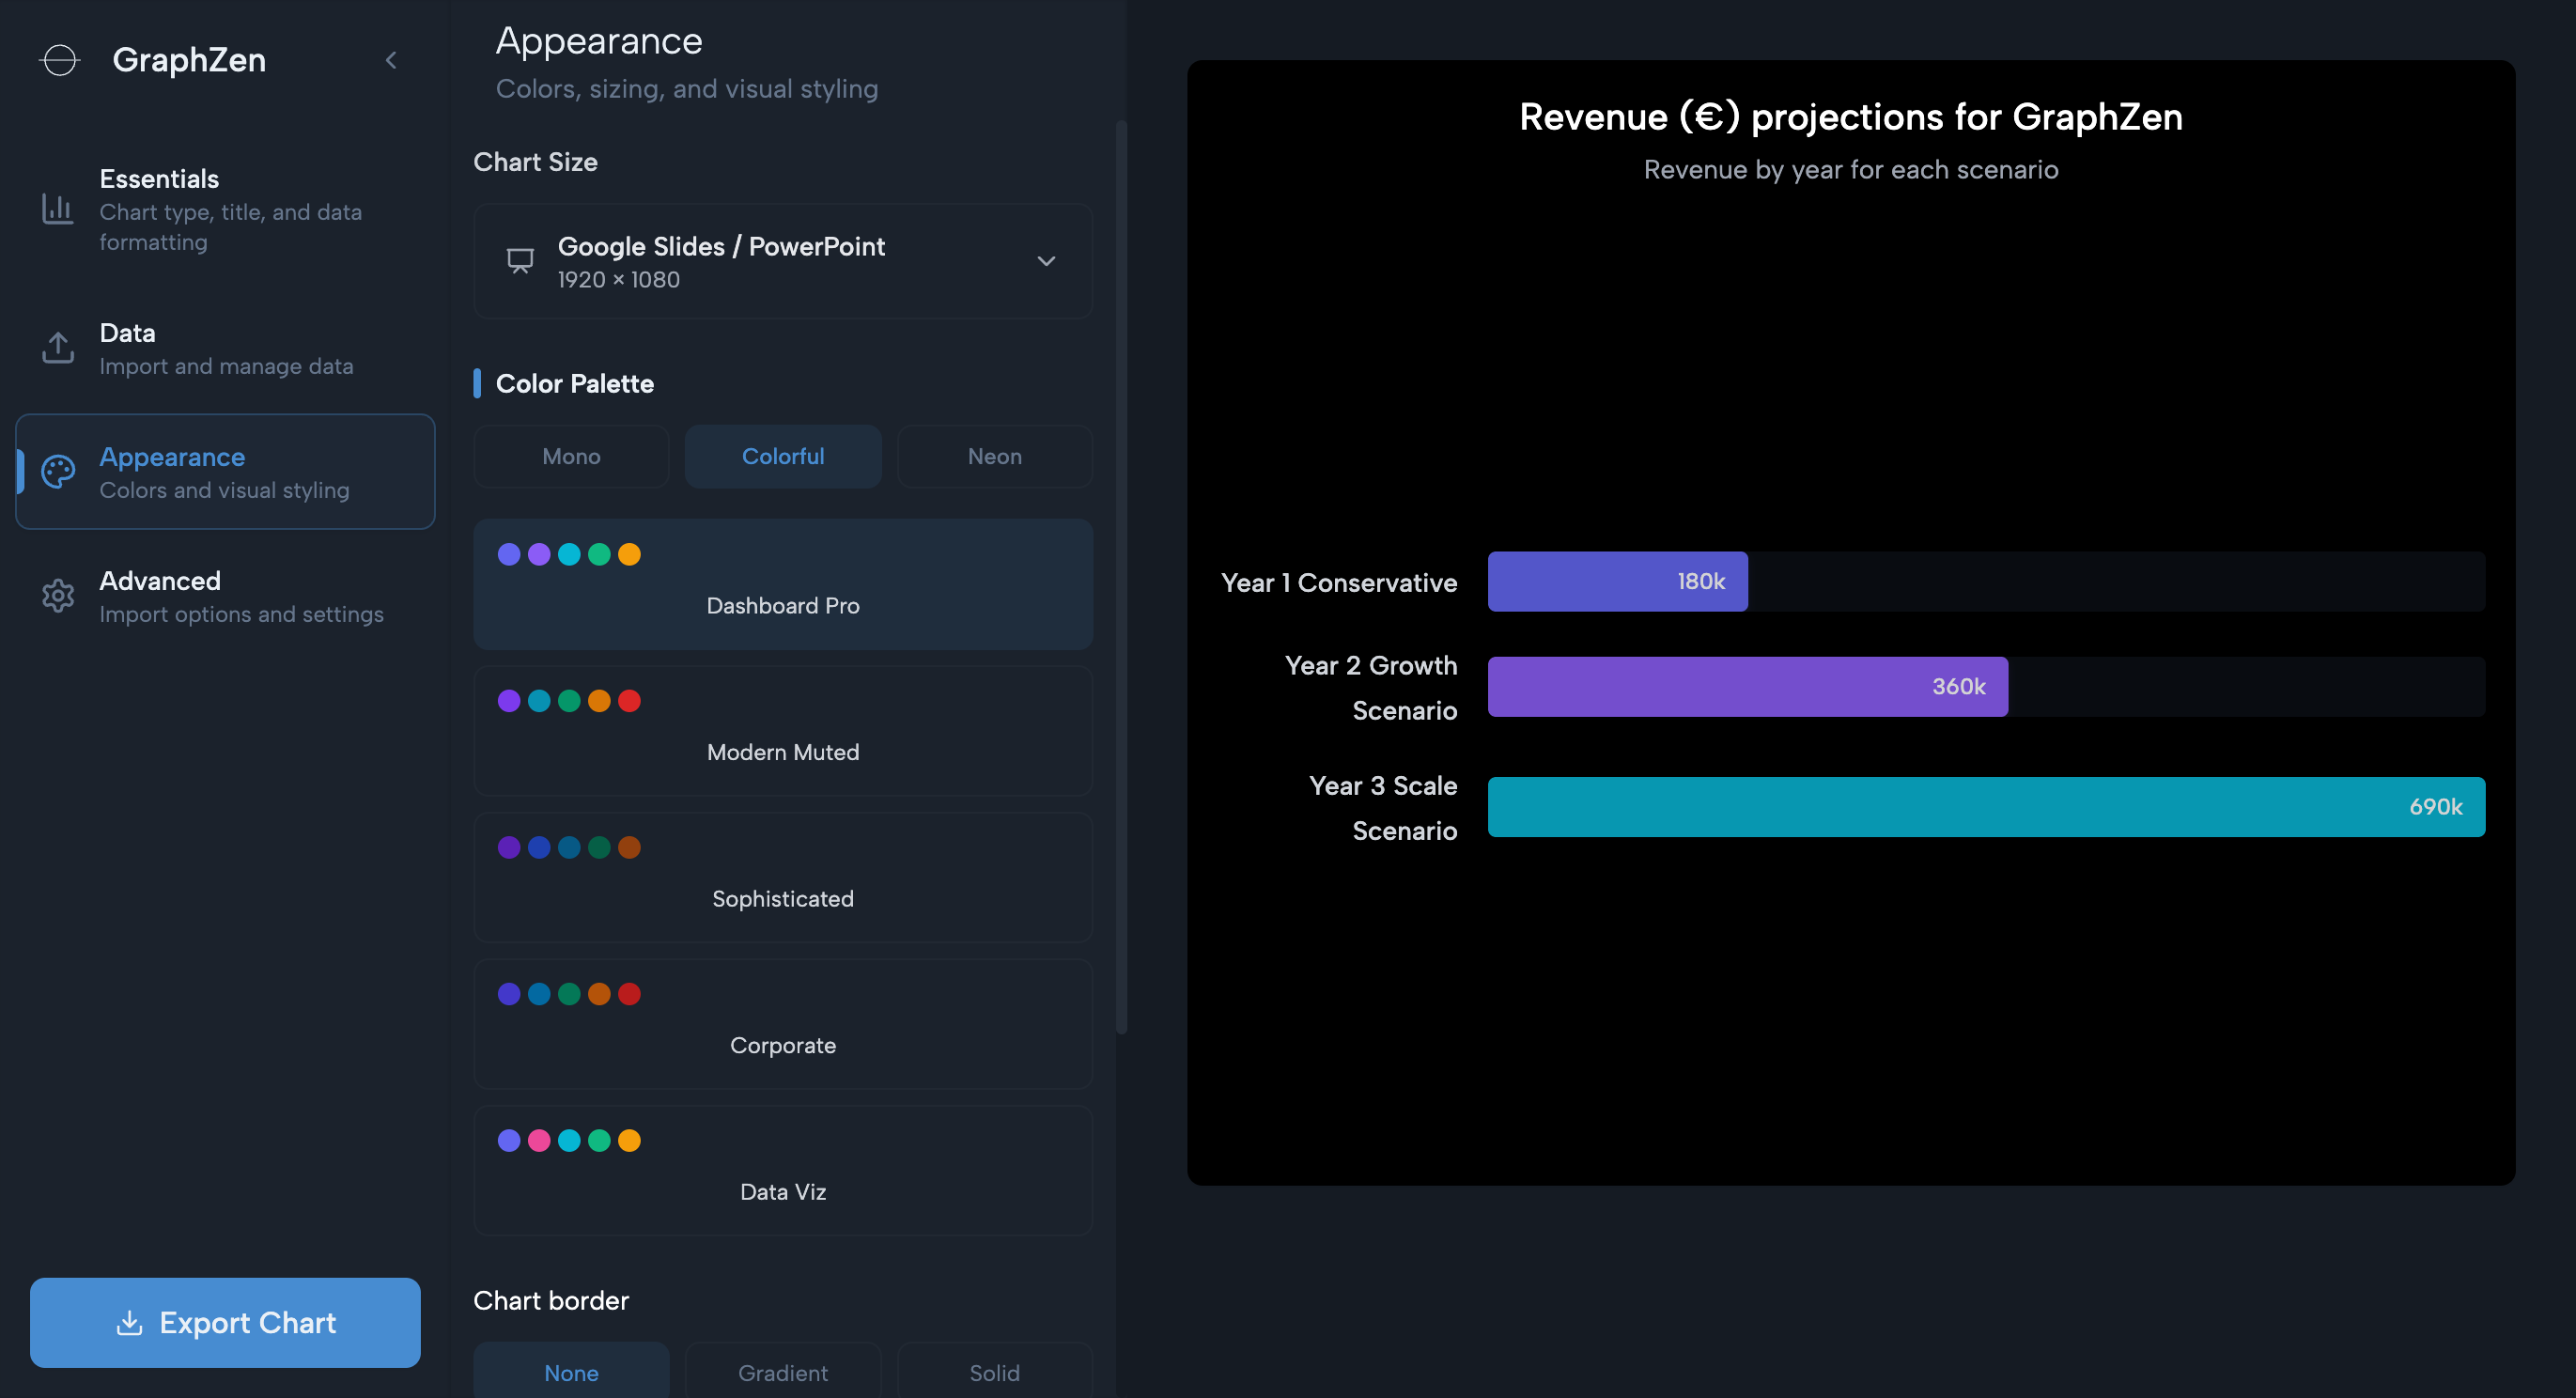
Beautiful Themes
Professional color palettes and styling options for any presentation.
Export Ready
Download as PNG, SVG, or embed anywhere. Perfect for reports, presentations, and websites.
Private & Secure
Your data never leaves your browser. No uploads, no servers, no privacy concerns.
How It Works
Create professional charts in just three simple steps.
Import Your Data
Paste data, upload CSV, or connect to Excel files - all processed locally in your browser
Choose Your Style
Select chart type and customize colors
Get Perfect Results
Professional charts ready for any presentation
Ready to create your own charts?
Start Creating NowWhy Choose GraphZen
Simplicity. Sophistication. Safety.
Save Hours of Work
What used to take hours in Excel or complex tools now takes minutes. Focus on insights, not formatting.
No Learning Curve
Intuitive interface that works immediately. No tutorials, no complicated menus, just results.
Your Data Stays Private
All processing happens in your browser. No data uploaded to servers, no privacy concerns.
Perfect for Teams
Export in multiple formats that work everywhere. Share charts that look professional in any presentation.
Perfect For Any Industry
Business Reports
Quarterly reviews, sales performance, and KPI dashboards
Academic Research
Research findings, survey results, and data analysis
Marketing Campaigns
Campaign performance, conversion rates, and audience insights
Financial Analysis
Budget tracking, expense reports, and financial forecasting
Start Creating Beautiful Charts Right Now
No account needed, no setup required. Just paste your data and get professional results instantly.